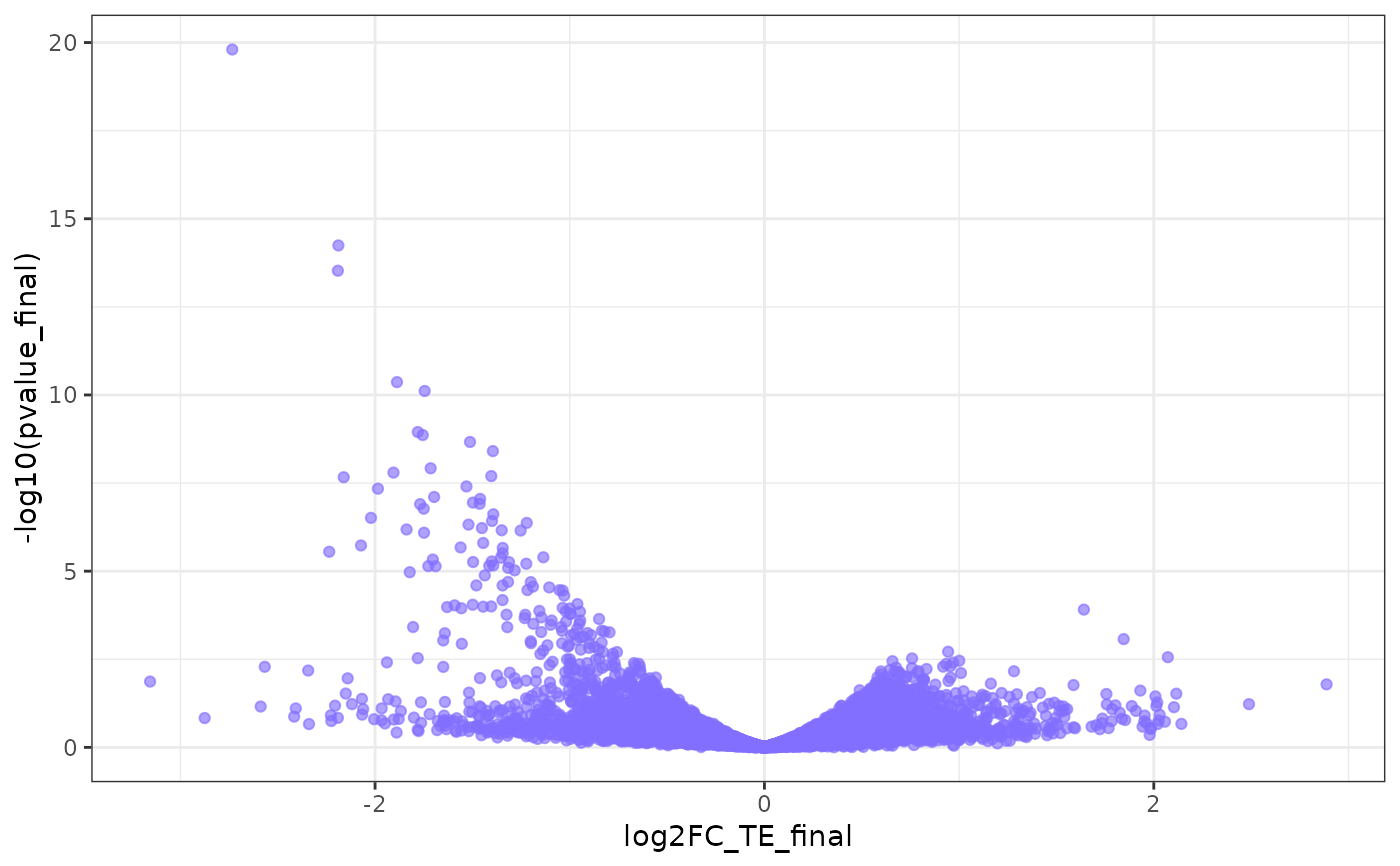
A simple function that plots log2 fold change of TE and -log10 of pvalues
The genes are color coded by P-value (-log10)
volcanoPlot(object, ...)

# S4 method for xtail
volcanoPlot(object)
Arguments
| object |
a xtail object |
| ... |
optional arguments. Currently not used |
Value
a ggplot object
Examples