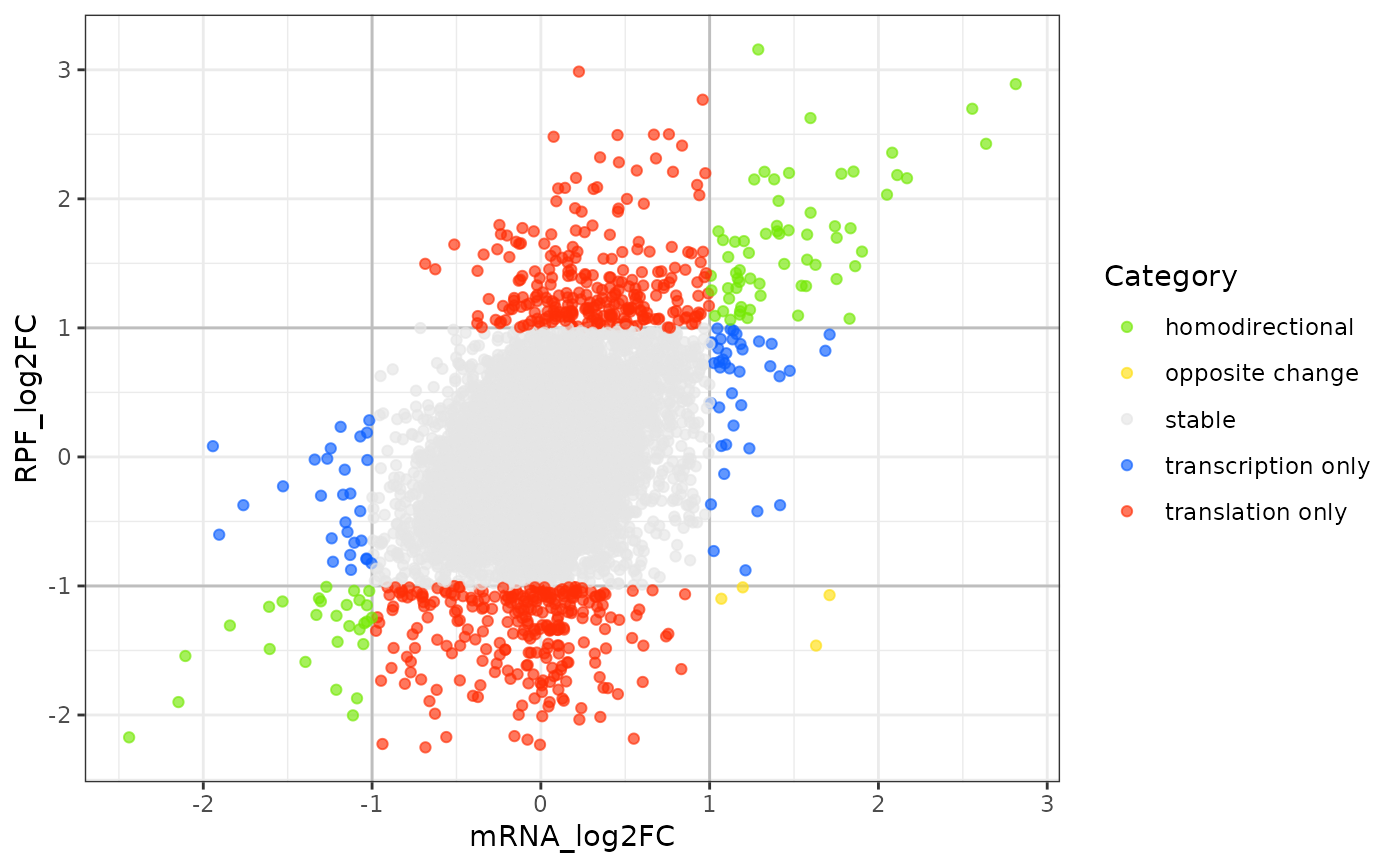
A simple function that plots the fold change in mRNA and RPF. Different classes of genes are labeled with different of color. Each dot, representing a particular gene, are color coded by the category of expression change.
plotFCs(object, ...)

# S4 method for xtail
plotFCs(object, log2FC.cutoff = 1, xlim = NULL, ylim = NULL)
Arguments
| object | a |
|---|---|
| ... | optional arguments. Currently not used |
| log2FC.cutoff | cutoff for categorizing results |
| xlim | argument for limiting the range plotted on the x axis. See
|
| ylim | argument for limiting the range plotted on the y axis. See
|
Value
a ggplot object