ROCR functions for Modifier and ModifierSet objects
Source: R/AllGenerics.R, R/Modifier-roc.R
plotROC.RdplotROC streamlines labeling, prediction, performance and plotting
functions to test the peformance of a Modifier object and the data
analyzed via the functionallity from the ROCR package.
The data from x will be labeled as positive using the coord
arguments. The other arguments will be passed on to the specific ROCR
functions.
By default the prediction.args include three values:
measure = "tpr"x.measure = "fpr"score = mainScore(x)
The remaining arguments are not predefined.
plotROC(x, coord, ...)

# S4 method for class 'Modifier'
plotROC(
  x,
  coord,
  score = NULL,
  prediction.args = list(),
  performance.args = list(),
  plot.args = list()
)

# S4 method for class 'ModifierSet'
plotROC(
  x,
  coord,
  score = NULL,
  prediction.args = list(),
  performance.args = list(),
  plot.args = list()
)
Arguments
- x
a
Modifieror aModifierSetobject- coord
coordinates of position to label as positive. Either a
GRangesor aGRangesListobject. For both types the Parent column is expected to match the gene or transcript name.- ...
additional arguments
- score
the score identifier to subset to, if multiple scores are available.
- prediction.args
arguments which will be used for calling
predictionform theROCRpackage- performance.args
arguments which will be used for calling
performanceform theROCRpackage- plot.args
arguments which will be used for calling
ploton the performance object of theROCRpackage. If multiple scores are plotted (for example if the score argument is not explicitly set)add = FALSEwill be set.
Value
a plot send to the active graphic device
References
Tobias Sing, Oliver Sander, Niko Beerenwinkel, Thomas Lengauer (2005): "ROCR: visualizing classifier performance in R." Bioinformatics 21(20):3940-3941 DOI: 10.1093/bioinformatics/bti623
Examples
data(msi,package="RNAmodR")
# constructing a GRanges obejct to mark positive positions
mod <- modifications(msi)
coord <- unique(unlist(mod))
coord$score <- NULL
coord$sd <- NULL
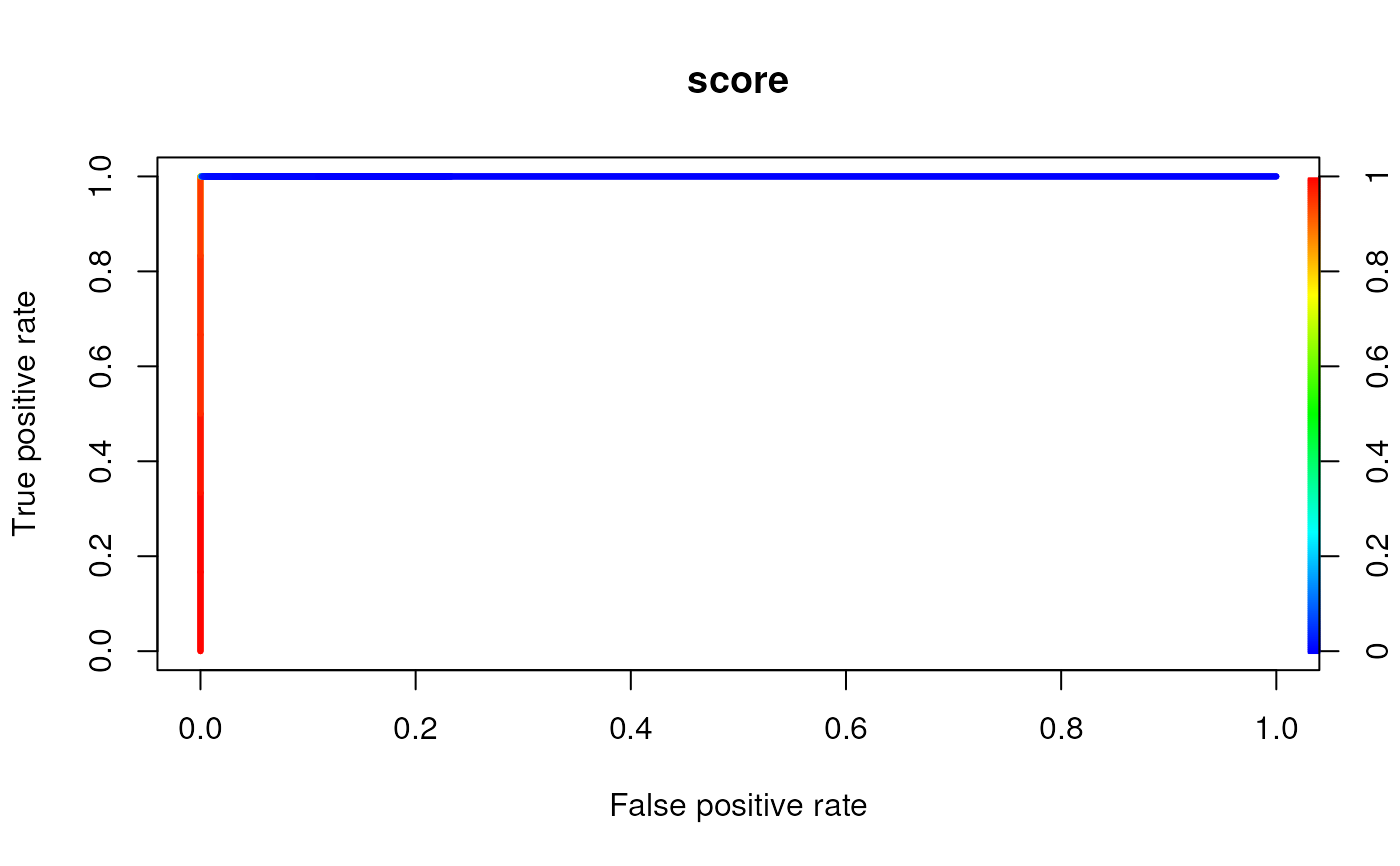
# plotting a TPR vs. FPR plot per ModInosine object
plotROC(msi[[1]],coord)
 # plotting a TPR vs. FPR plot per ModSetInosine object
plotROC(msi,coord)
# plotting a TPR vs. FPR plot per ModSetInosine object
plotROC(msi,coord)