Visualizing data data from a SequenceData, SequenceDataSet, SequenceDataList, Modifier or ModifierSet object.
Source: R/AllGenerics.R, R/Modifier-viz.R, R/ModifierSet-viz.R, and 3 more
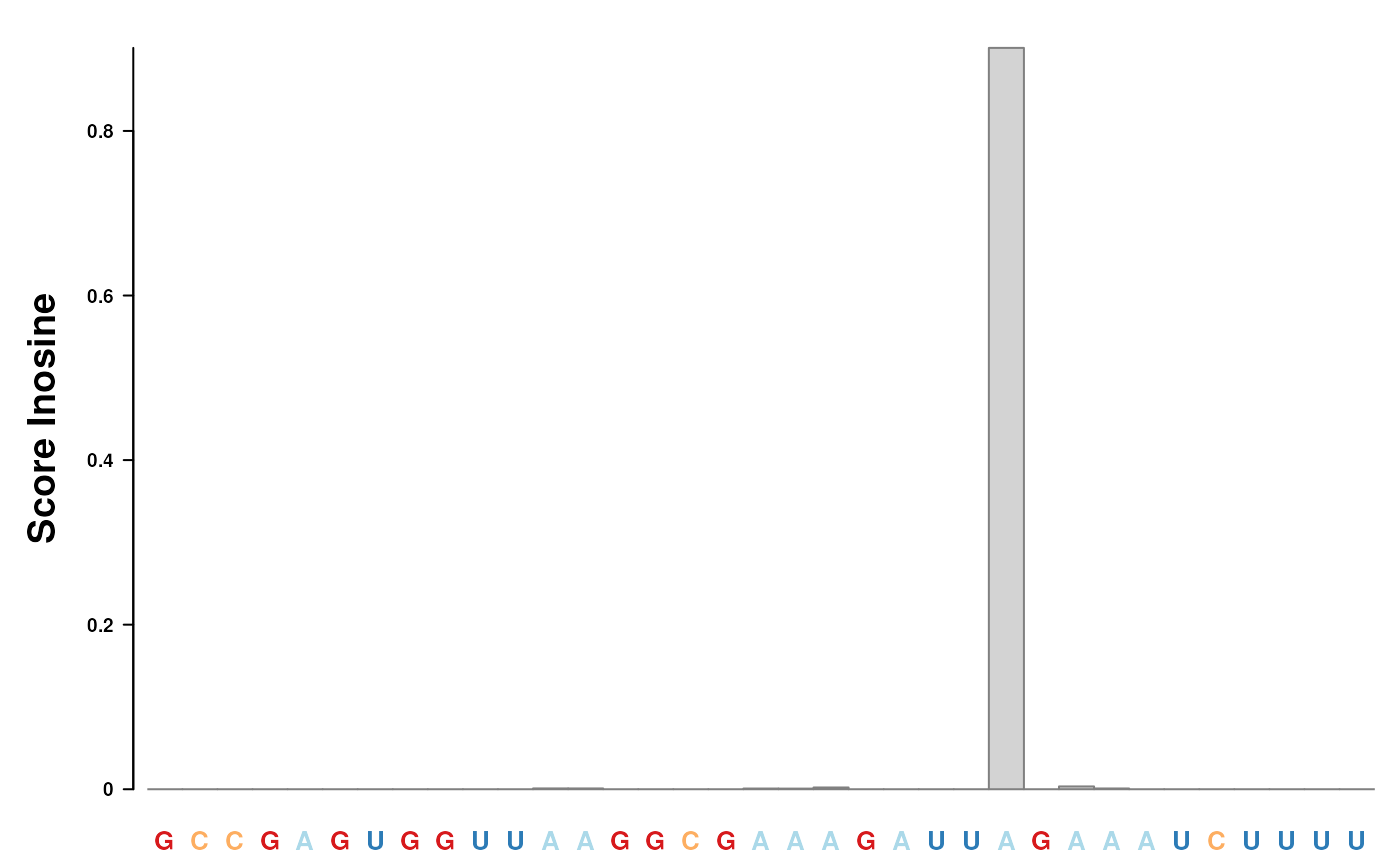
plotData.RdWith the plotData and plotDataByCoord functions data
from a SequenceData, SequenceDataSet, SequenceDataList,
Modifier or ModifierSet object can be visualized.
Internally the functionality of the Gviz package is used. For each
SequenceData and Modifier class the getDataTrack is
implemented returning a DataTrack object
from the Gviz package.
Positions to be visualized are selected by defining a genomic coordinate,
for which x has to contain data.
plotData(x, name, from = 1L, to = 30L, type, ...)

plotDataByCoord(x, coord, type, window.size = 15L, ...)

getDataTrack(x, name, ...)

# S4 method for class 'Modifier,GRanges'
plotDataByCoord(x, coord, type = NA, window.size = 15L, ...)

# S4 method for class 'Modifier'
plotData(
  x,
  name,
  from,
  to,
  type = NA,
  showSequenceData = FALSE,
  showSequence = TRUE,
  showAnnotation = FALSE,
  ...
)

# S4 method for class 'Modifier'
getDataTrack(x, name = name, ...)

# S4 method for class 'ModifierSet,GRanges'
plotDataByCoord(x, coord, type = NA, window.size = 15L, ...)

# S4 method for class 'ModifierSet'
plotData(
  x,
  name,
  from,
  to,
  type = NA,
  showSequenceData = FALSE,
  showSequence = TRUE,
  showAnnotation = FALSE,
  ...
)

# S4 method for class 'SequenceData,GRanges'
plotDataByCoord(x, coord, type = NA, window.size = 15L, ...)

# S4 method for class 'SequenceData'
plotData(
  x,
  name,
  from,
  to,
  perTranscript = FALSE,
  showSequence = TRUE,
  showAnnotation = FALSE,
  ...
)

# S4 method for class 'SequenceData'
getDataTrack(x, name = name, ...)

# S4 method for class 'SequenceDataList'
getDataTrack(x, name = name, ...)

# S4 method for class 'SequenceDataList,GRanges'
plotDataByCoord(x, coord, type = NA, window.size = 15L, ...)

# S4 method for class 'SequenceDataList'
plotData(
  x,
  name,
  from,
  to,
  perTranscript = FALSE,
  showSequence = TRUE,
  showAnnotation = FALSE,
  ...
)

# S4 method for class 'SequenceDataSet'
getDataTrack(x, name = name, ...)

# S4 method for class 'SequenceDataSet,GRanges'
plotDataByCoord(x, coord, type = NA, window.size = 15L, ...)

# S4 method for class 'SequenceDataSet'
plotData(
  x,
  name,
  from,
  to,
  perTranscript = FALSE,
  showSequence = TRUE,
  showAnnotation = FALSE,
  ...
)
Arguments
- x
a
SequenceData,SequenceDataSet,SequenceDataList,ModifierorModifierSetobject.- name
Only for
plotData: the transcript name- from
Only for
plotData: start position- to
Only for
plotData: end position- type
the data type of data show as data tracks.
- ...
optional parameters:
modified.seq:TRUEorFALSE. Should the sequence shown with modified nucleotide positions? (default:modified.seq = FALSE)additional.mod: other modifications, which should be shown in the annotation and sequence track. The must be aGRangescompatible withcombineIntoModstrings.annotation.track.pars: Parameters passed onto theAnnotationTrack.sequence.track.pars: Parameters passed onto theSequenceTrack.
- coord
coordinates of a positions to subset to as a
GRangesobject. The 'Parent' column is expected to match the transcript name.- window.size
integer value for the number of positions on the left and right site of the selected positions included in the plotting (default:
window.size = 15L)- showSequenceData
TRUEorFALSE: should the sequence data be shown? (default:seqdata = FALSE)- showSequence
TRUEorFALSE: should a sequence track be shown? (default:seqdata = TRUE)- showAnnotation
TRUEorFALSE: should a annotation track be shown? (default:seqdata = FALSE)- perTranscript
TRUEorFALSE: Should the positions shown per transcript? (default:perTranscript = FALSE)
Value
a plot send to the active graphic device
Examples
data(msi,package="RNAmodR")
plotData(msi[[1]], "2", from = 10L, to = 45L)

if (FALSE) { # \dontrun{
plotData(msi, "2", from = 10L, to = 45L)
} # }
if (FALSE) { # \dontrun{
plotData(msi, "2", from = 10L, to = 45L)
} # }